Python Tools for Computational Molecular Biology
Python Tools for Computational Molecular Biology
ABI trace files can be useful to inspect. While there are ready-made solutions available, you may find yourself in a place where you need to write your own code to programmatically interact with the traces. Biopython allows us to do so.
I show below an interactive IPython terminal session, using my own Sanger sequencing file, but it will work with other AB1 files.
Firstly, we read in the ABI file:
from Bio import SeqIO

record = SeqIO.read("55-Mn-fw-EM-28.ab1", "abi")
The data that we are most interested in is in the annotations attribute of the record.
>>> list(record.annotations.keys())
dict_keys(["dye", "abif_raw", "sample_well", "run_finish", "machine_model", "run_start", "polymer"])
Under abif_raw is another dictionary of data.
>>> list(record.annotations["abif_raw"].keys())
dict_keys(["DATA5", "DATA8", "RUNT1", "phAR1", ..., "DATA6"])
According to the ABI data specification (page 40), all of the data necessary for the traces that are conventionally displayed are in the DATA9 through DATA12 channels. We can grab these channels out programmatically. It isn’t stated clearly, though, what letters correspond to which colour, and hence which exact channel.
from collections import defaultdict

channels = ["DATA9", "DATA10", "DATA11", "DATA12"]
trace = defaultdict(list)
for c in channels:
    trace[c] = record.annotations["abif_raw"][c]
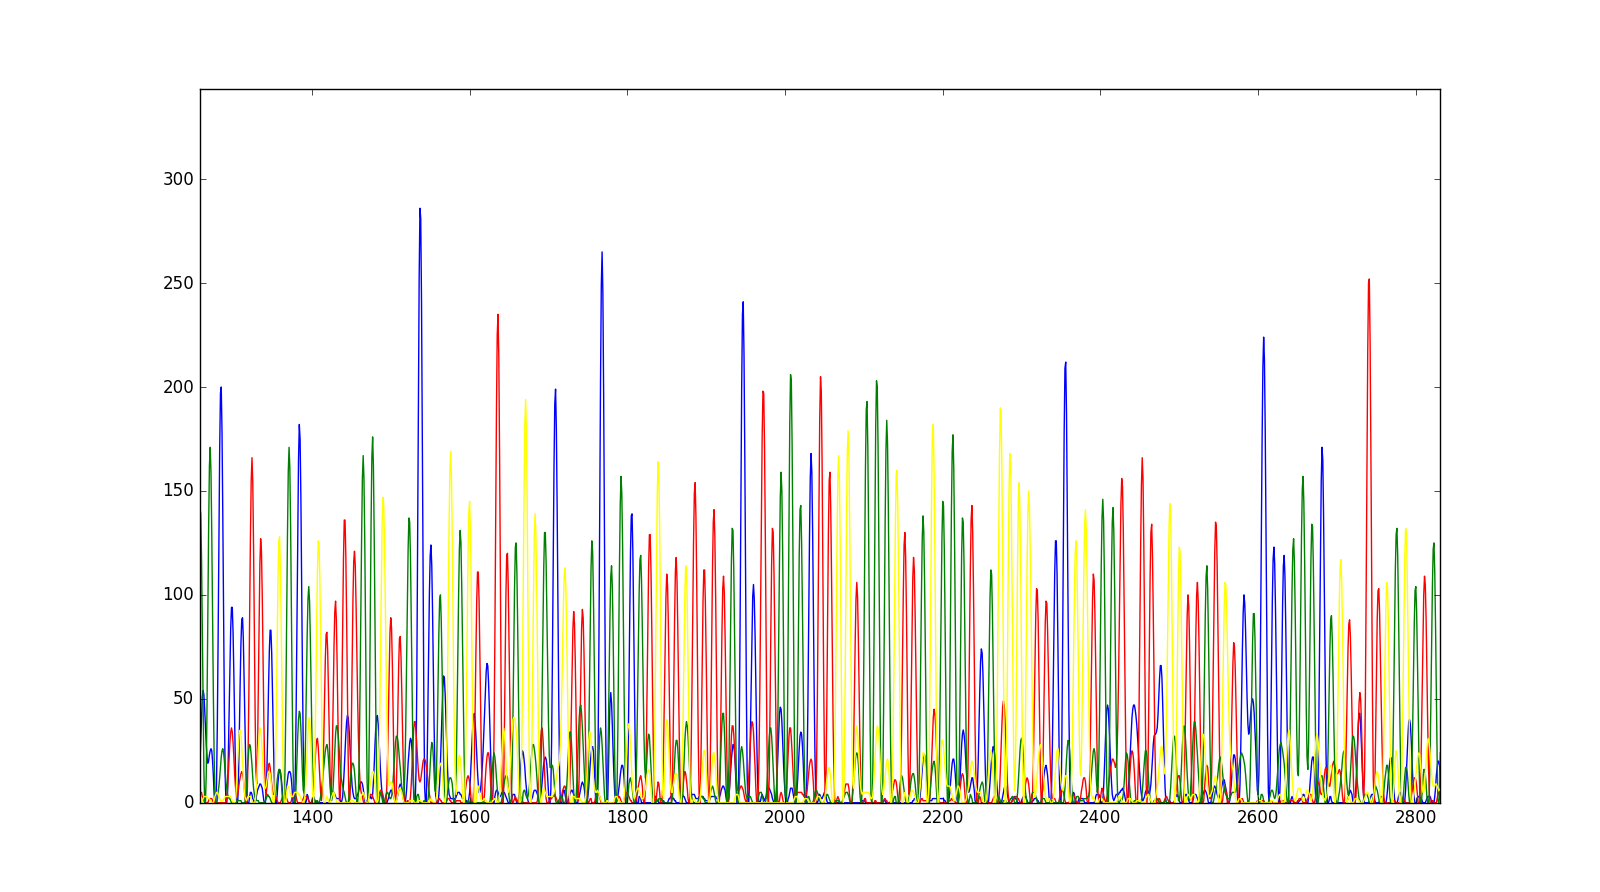
Now, it’s possible to plot them on a matplotlib figure.
plt.plot(trace["DATA9"], color="blue")
plt.plot(trace["DATA10"], color="red")
plt.plot(trace["DATA11"], color="green")
plt.plot(trace["DATA12"], color="yellow")
plt.show()
We will get the following trace, after zooming into a particular region.
As of current writing, this cookbook recipe didn’t go further into computing metrics. One particular thing that may be interesting is to quantify the Shannon Diversity of mixed base calls vs. single base calls.
Another thing to note: There are 10 chromatogram values per base in the data. Therefore, that means that it may be advisable to grab every 5th value out, so that the final length of the sequence trace array matches up with the number of positions that should have been sequenced, rather than being 10x larger.